
(written and illustrated by Vlado Damjanovski, ViDi Labs © 2019)
Our main objective over the past 35 years of professional CCTV activity has always been to educate, clarify and demystify the science of CCTV. This article is intended to add some clarity about the latest resolution standards.
The newly adopted IP VSS standard IEC 62676-5 define measuring CCTV camera resolution in a slightly different manner to what was the case in the past, with the analogue cameras.
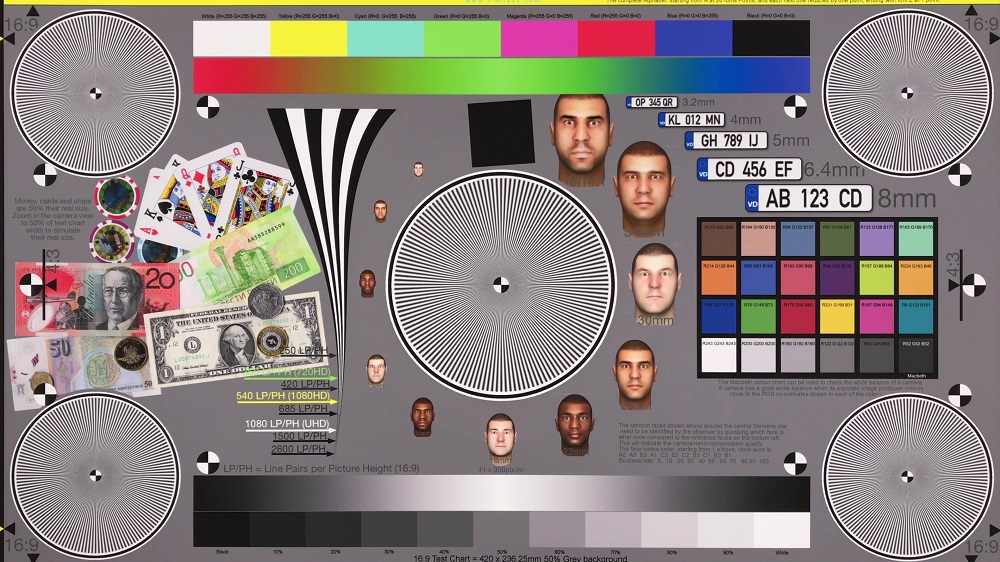
As we already described in our previous post, ViDi Labs has developed a new test chart v.5.0 for testing cameras of any resolution from SD (768×576), HD (1920×1080) and up to UHD (3840×2160), and higher. We also said that, base don this test chart, we developed a special software to make camera evaluation as easy and as objective as possible.
In this post we would like to explain how the resolution is measured, according to these new standards.
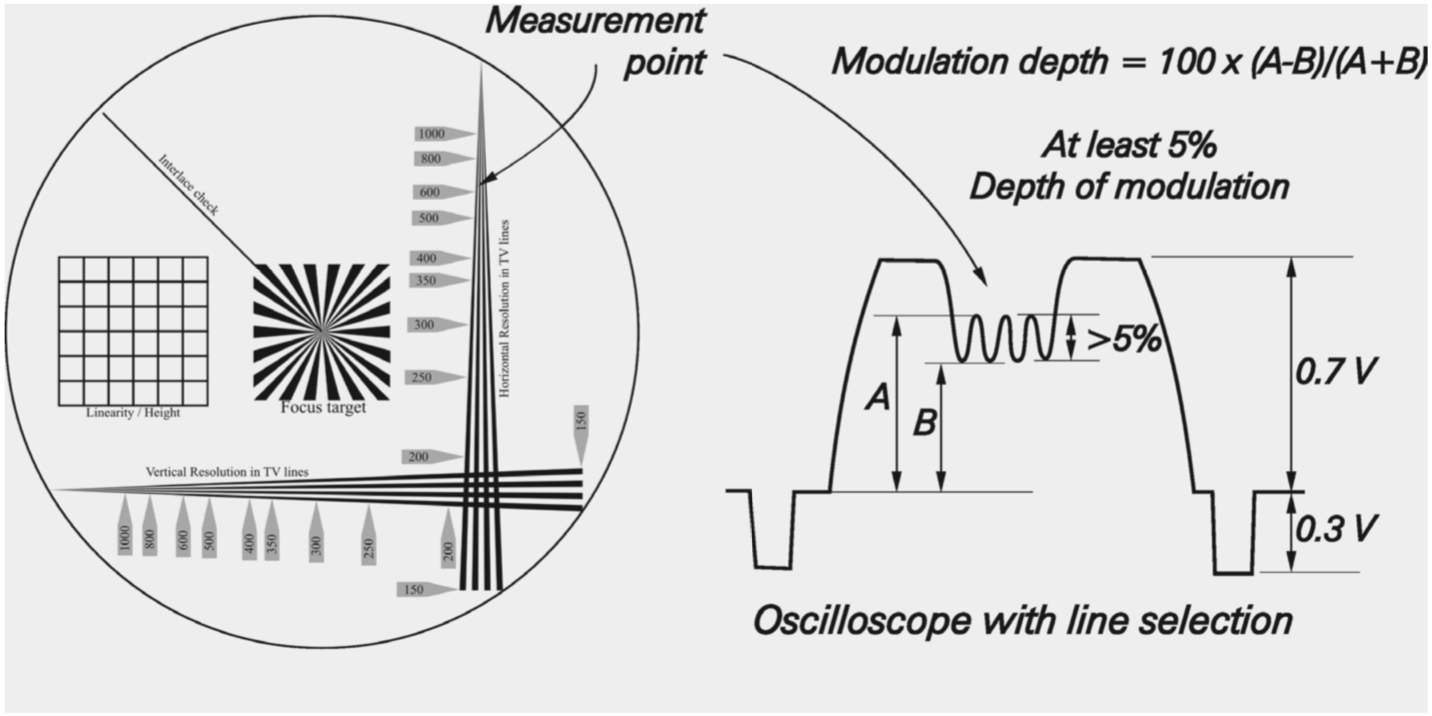
The first important difference is that we should no longer use TVL (Television Lines) terminology to describe resolution. This was the resolution defined in the analogue TV as 3/4 of the vertical lines that could be counted across the screen width, being 4:3 aspect ratio. When using test charts, this is the point where four or more resolution wedges converge to three or two, judging by (subjective) visual inspection. A more accurate, and more objective method, during the ‘analogue times’ was to have 5% ‘depth of modulation’ of black and white lines of the wedges when inspected with an accurate, line selective, oscilloscope.
The new standards have switched to using Line Pairs per Picture Height (LP/PH), instead of TVL. This puts the IP CCTV cameras in the same group as the resolution defined in photography.
The LP/PH refers to the maximum number of line pairs (black and white lines) across the width of the video picture, equivalent to the picture height. We are referring to line pairs simply because if you don’t have white lines in the sensor column after the black ones, you will not be able to see any pattern. If there are only black lines projected on each sensor column (or row) there will be nothing but black picture. We have to have white after the black to determine the maximum resolution. This is why we now talk about ‘line pairs’.
A high quality HD video image, composed of 1920×1080 pixels real-estate, by definition can show no more than 1920/2 = 960 pairs of B/W lines across the width of the screen. This maximum number of 960 is then ‘normalised’ to the 16:9 aspect ratio of HD, so we have 960:16×9=540., which we could call ‘line pairs per picture height, (LP/PH).’
So the maximum resolution an HD signal can have is 540 LP/PH.
Similarly, the maximum resolution an UHD (4k) signal can have is 1080 LP/PH.
If a sensor is not the ‘standard 16:9’ aspect ratio, the appropriate LP/PH can still be presented using such sensor aspect ratio.
As we all know, the resolution depends not only on the sensor itself, but also on the matching optics. In fact, lenses are almost always the bottle neck in CCTV.
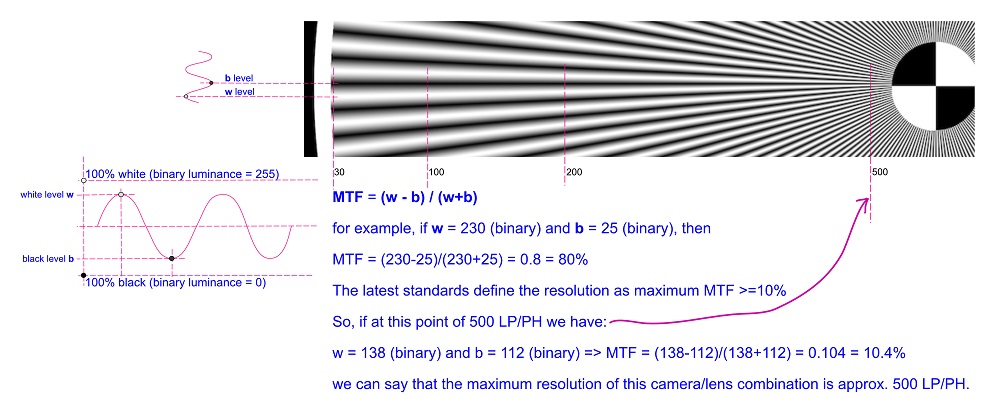
The next difference in the new standard, compared to the old analogue standards, is that we refer to the maximum resolution at the point where depth of modulation is equal or better than 10%.
The depth of modulation is defined the same as in analogue CCTV, but now the limit as at 10%. If the white line peak is w, and the black deep is b, than the modulation is defined as:
M = (w – b) / (w + b) x 100 [%]
So when this M <= 10%, we say this is the limit of the resolution of the camera/lens combination.
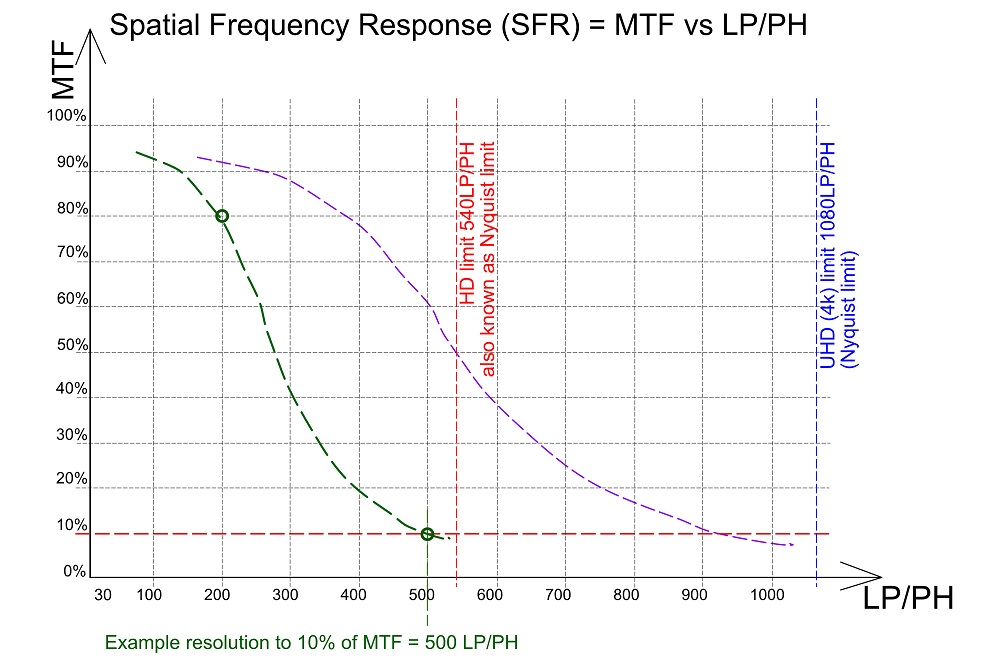
The curve that describes the resolution M, versus the resolution (LP/PH) is usually referred to as Modulation Transfer Function (MTF), but also as Spatial Frequency Response (SFR).
The maximum resolution of a camera is to the 10% point on this curve.
As explained on our previous post about our new test chart v.5.0, we now use Siemens sine-wave stars for more accurate resolution measurements. Although we could do this by way of visual judgement based on the exported JPG image from a video stream, we mentioned that we have developed a software algorithm to make these measurement objectively, by the accurate algorithm we developed.
The ‘sine-wave’ term refers to the changing of black to white, which is not sudden, abrupt, but goes continuous from black to white following a ‘sine-wave’ law.

According to the latest standards, the resolution can be measured at around 1000 lux or more illumination at the test chart.
At lower illumination levels the resolution will always be lower, which is why the standards suggests that you should have at least 1000 lux reflected of the test chart when measuring resolution. You can certainly use less than 1000 lux, and although that will not show you the best resolution for the camera/lens combination, you can compare it with another model, but make sure you have the same light level in order to have an objective comparison.
If you want to evaluate, compare or test your cameras, please feel free to visit our web site (https://vidilabs.com/testcharts.html) and order the latest test chart.
We offer our software testing for free from your exported images.