
(written and illustrated by Vlado Damjanovski © 2019)
ViDi Labs has just finished designing its latest test chart for the CCTV industry, v.5.0.
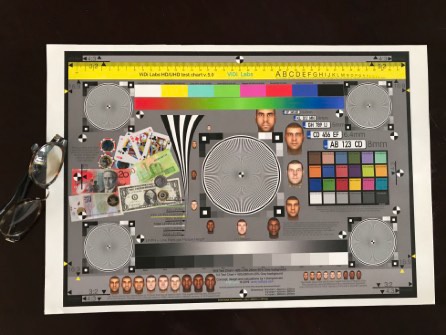
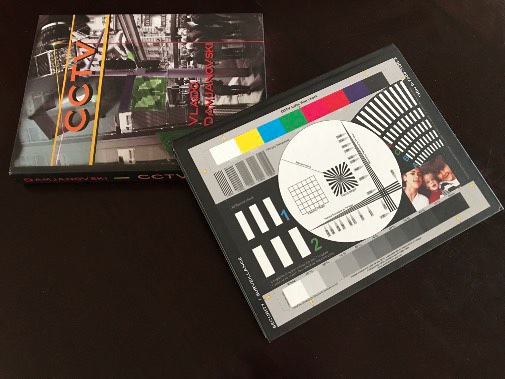
“ViDi Labs latest test chart v.5.0”
This is a great update with many new features that will easily and convincingly indicate various camera qualities. The new test chart is intended for cameras with various aspect ratio imaging sensors such as 16:9, 3:2 and 4:3, including the most common HD resolution (1920×1080 pixels), the new UHD (aka 4k, with 3840×2160 pixels) and all other megapixel cameras. Most importantly, this new test chart accommodates the latest CCTV standards, including the IEC 62676-4 and 62676-5 standards and continuous sine-wave Siemens stars for better resolution measurements, faces, money and cards samples, number-plates, as well as Macbeth colour chart. Here at ViDi Labs, we felt it was time for a test chart update.
However, before I explain all the innovations that are included in this new design, I would like to go back in time and give you a history of the test charts we have been producing for over twenty-five years. It may come as a surprise to some that we were the first in the industry to introduce test charts for the CCTV industry.
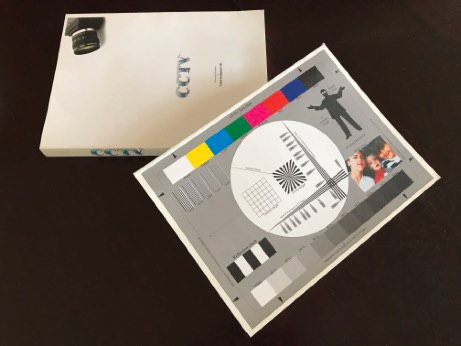
“The very first test chart v.1.0 (1995)”
Back in 1994, I wrote and published my first book on the subject of CCTV (simply called ‘CCTV’). At the time it was the fundamental book in the world on this subject. My intentions were not only to demystify Closed Circuit Television technology but, equally, to offer a tool to CCTV customers that they could use to test, analyse and compare cameras. It was during this time that I came up with an idea to design a test chart that could be printed on the back cover of this first book. So, not only could one read the book, but they could also use the back cover as a test target as well.
The broadcast TV industry was already using the popular RETMA (acronym for Radio Electronics Television Manufacturers’ Association) chart for many years, yet this was mostly for checking resolution and linearity of the system – due to tube cameras’ geometrical distortions – and grey steps for Gamma testing. Even so, it had no colours or reference to face sizes for identification purposes, much needed in CCTV. I could have simply reproduced the RETMA pattern at the back of the book, but I wanted to do something more. This is how the idea of the first CCTV test chart v.1.0 was born, under the umbrella of my then company – CCTV Labs.
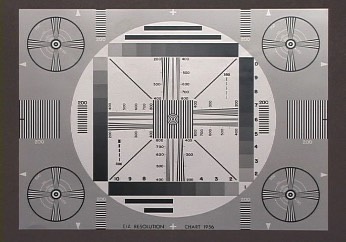
“EIA RETMA chart”
Although this test chart was small and printed on the back cover of an A4 format book, the v.1.0 chart had sufficient clarity and precision to reproduce resolution wedges, colour bars and grey steps, focus target, linearity squares and bandwidth bars. Furthermore, for the first time in the industry human faces were introduced. The A4 format aspect ratio of 1:1.41 suited the 4:3 aspect ratio of 1:1.33 of analogue CCTV cameras so there was not much wasted space around the chart. The instructions on how to use the test chart were printed inside the book.
“The first test chart was on the back-cover”
After receiving comments and feedback from many happy customers it proved my intentions were welcomed and the first test chart became a useful tool for evaluating and comparing cameras and systems. CCTV users had now started operating a bit more scientifically, and I was proud of my contribution towards this science.
In 1998 I was approached by the leading US publisher Butterworth Heinemann. They asked if I would re-write the book and include the NTSC standards. I also had to ‘americanise’ the English text in order for them to publish it under their banner. I agreed to this offer which allowed the book to be marketed internationally and which freed me up financially.
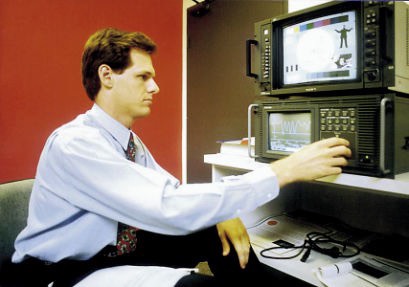
“The first test chart v.1.0 tested at Tektronix”
This second edition – which Americans consider their first edition – was launched in 1999 at the ISC show in New York. This was when CCTV Labs introduced v.2.0 of the CCTV test chart, also at the rear of the book. Thankfully, Butterworth Heinemann decided to publish the book with a hard cover which made the appearance of the test chart more sturdy and uniform.
The innovations introduced in v.2.0 included adding the German ORUA bars standard that helped in improving face identification quality with various thickness bars at an angle, in addition to the existing faces. We also introduced the reflection check bars that could be used to determine signal reflections of badly terminated coaxial cables in the analogue video transmission.
“The second test chart v.2.0”
With v.2.0 test chart, we decided to produce it in an A3 printed format separate from the book. The improvement of ink-jet colour printer technology allowed us to produce more precise colour details on the chart from what was possible with the traditional off-set printing used for the book back cover. This was not an easy task as we had to do a complete colour calibration between the computer, scanner and printer, but we achieved accuracy that is reproducible and well above the industry requirements.
This 1999 edition published by Butterworth Heinemann quickly became a best-seller on www.amazon.com, as did all subsequent editions. Due to the popularity of the book, we were soon producing and selling CCTV test charts throughout the world. Hundreds of CCTV manufacturers, consultants and integrators purchased the v.2.0 test chart and I was delighted that my original idea of CCTV specific test charts became recognised globally.
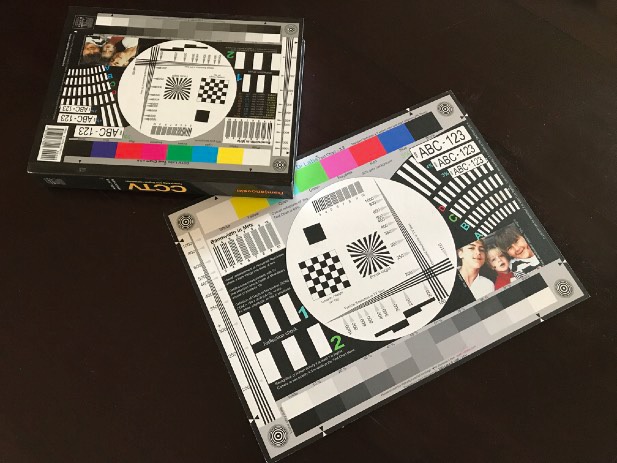
“The back-cover test chart v.3.0 and a stand-alone A3 format”
The early 2000s saw rapid development in CCTV technologies, including the switch from analogue to digital technology. Initially, this was only standard definition (SD) but DVRs and NVRs started replacing VHS and S-VHS recorders. I now saw the need for an updated test chart to reflect these changes.
In 2005, I launched the second American book edition called ‘CCTV – Digital and Networking technologies’ at the ISC West show in Las Vegas. Along with this book, I launched test chart version 3.0 on the back cover. We were also producing a stand-alone, A3, hard mounted version which was now ordered via our web site.
This updated version included vehicle number plates (as per the newly published Australian Standard AS 4806-2), some additional co-ordinates of the line count when using an oscilloscope (to indicate the exact resolution wedges location), tilted squares for MTF analysis (by the slanted edges software methods) and, last but not least, a two-way grey scale chart to check system Gamma.
The stand alone test charts now proved more popular than the book option so it was decided to stop reproducing the charts on the back cover of future editions. Additionally, the book reproductions were out of our control and way below in quality what we could achieve with our colour calibrated printing process on A3 special non-reflective photographic paper. Now, all test charts, from v.3.0 onwards, were produced only in high quality A3+ format, mounted on light, yet rigid gato-board. This new format was safe yet not expensive to mail world-wide.
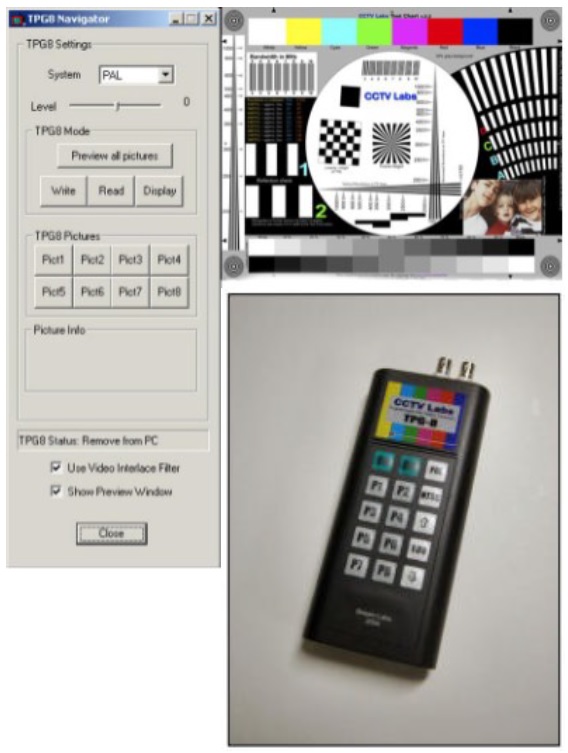
“The TPG8 programmable Test Pattern Generator with the test chart v.3.0 produced electronically”
Between the years 2000 and 2005, we designed were and produced an electronic programmable Test Pattern Generator (TPG-8), another first for the industry.
The TPG8 produced the test chart v.3.0 completely electronically and not through a camera. This allowed for perfect monitor adjustments, as well as testing various system transmissions and SD compressions.
For the first time in the industry, users were able to design their own test chart patterns and upload them into the TPG8 via a special software. Up to eight patterns were possible to be loaded, one of which was the test chart v.3.0.
Post 2005, and we saw another technological revolution in CCTV. Standard Definition resolution with 4:3 aspect ratio was now overtaken by the new High Definition television standard in 16:9 aspect ratio. New video compressions like H.264 were introduced and IP networks became the norm for CCTV. The book publisher, and industry, demanded a new edition of my book relating the latest digital and IP technologies. As expected, an updated version of the test chart had to be produced.
So, the next edition of the book was re-written over two years (2011~2013) and launched in 2013. During this time I also designed and produced a new test chart under our new company name, ViDi Labs. A new test chart, that could consider the range of sensors, resolutions and aspect ratios now available in the CCTV industry, had to be developed. This was a tough call, yet was launched as the new ViDi Labs SD/HD test chart v.4.0.
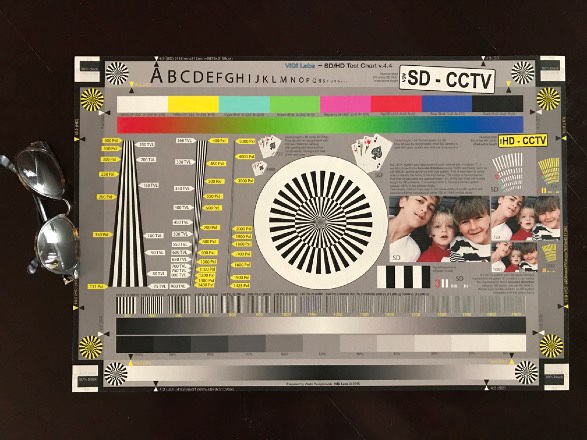
“Test SD/HD chart v.4.x with eye-glasses for comparison”
V.4.0 was the first chart in the CCTV industry to consider the range of sensors and aspect ratios. Starting with the old television 4:3 aspect, then the 3:2 ratio typical for photographic sensors, and finally the 16:9 typical for HD standards; these were all now found on one physical chart!
V.4.0 had to be designed with extreme accuracy, down to the hundredth of a millimetre (0.01mm), since it was intended for measuring very high resolution cameras. This was more easily said, than done because standard vector software was unable to provide such accuracy. A special vector based software had to be used to achieve this. Wedges and lines were calculated very precisely so that even the highest resolution IP cameras could be tested. We ensured that users could measure and quantifying image quality both in TV Lines (for the old ‘analogue school’), as well as in pixels.
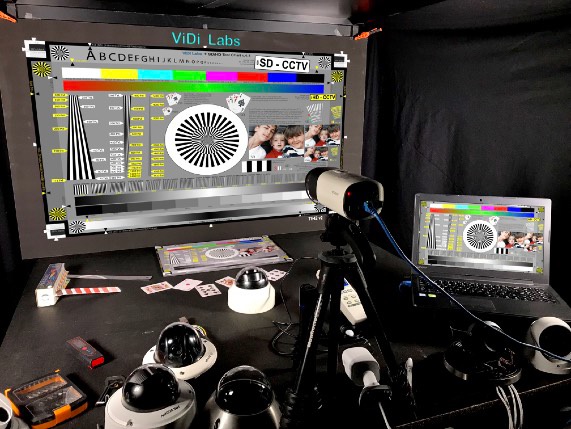
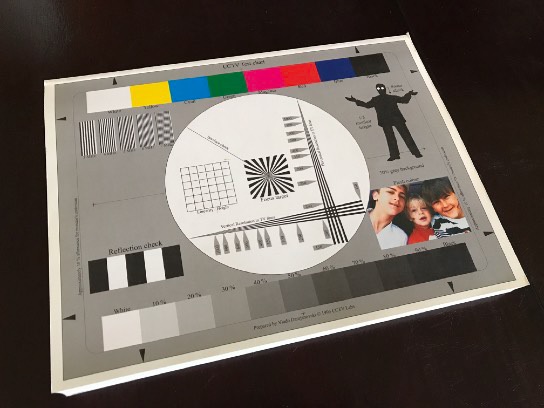
“Test SD/HD chart v.4.x in our labs”
We also introduced the novel idea of qualifying compression quality. This is one of the hardest things to do visually, and one would think it is not even possible. We introduced bars with continuous colour change, red-togreen-to-red, and also continuous gradation black-to-white-to-black bars.
These bars are so seamless that a human eye would not see any discontinuity in the printing. This was a mammoth task as, in addition to having a high accuracy colour management system, it also required a very high quality printer; the best paper surface and ink system. Repeatability of good quality is only possible with the highest control over all elements in the computer imaging system.
When such continuous bars are viewed by the IP camera under test, they would lose some of their continuity due to the quantisation process and the compression used. This typically happens when using JPG and H.264 compressions where 8-bit quantisation and lossy compression is used. By observing and comparing the banding in the continual bar tones, users may visually determine and compare various image and video compressions without even knowing the settings in the IP camera. Truly, a first concept of this kind in the industry.
To the best of my knowledge – there is nothing similar in the test chart world and certainly not in the CCTV industry.
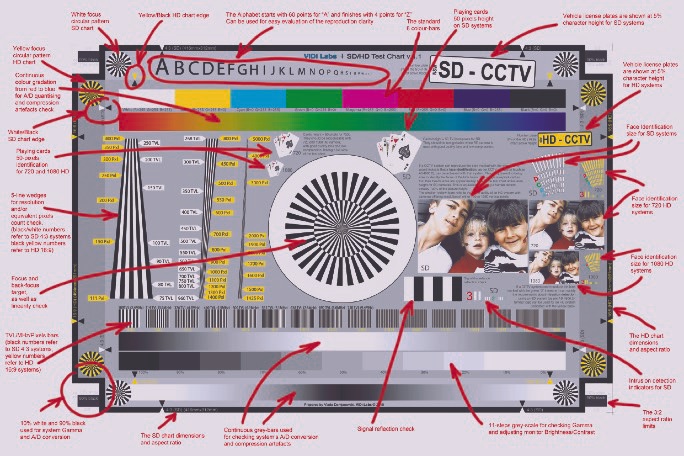
“Visual instructions of the test chart v.4.x at the back of it”
In the ViDi Labs SD/HD test chart v.4.0 we also introduced various face sizes in order to indicate the facial identification standards in the image. We made sure we had faces for SD resolution, 720p as well as 1080 resolution and we also kept the ORUA non-faced detection of quality applicable to FI.
We introduced images of playing cards for the casino industry as well as vehicle licence number-plates with various sizes suitable for SD and HD resolutions. The focus target has been improved and used on all edges of the test chart for easy focusing, as well as spotting focus issues with IP cameras. In order to make the chart easier to use, and know how each part of the chart works, we have included visual instructions on the back of the chart.
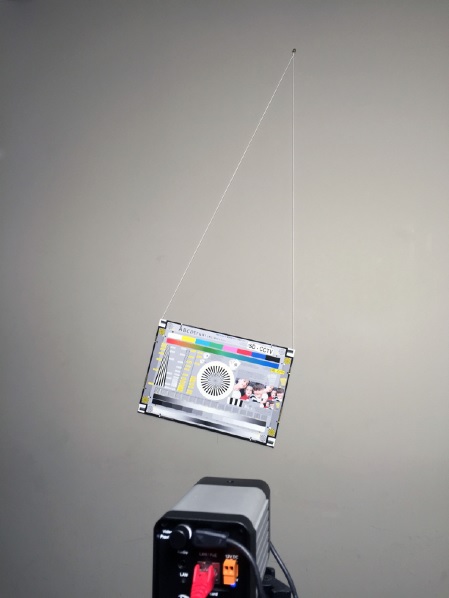
“Measuring motion blur of the camera”
Again, for the first time in the CCTV industry, we have expanded the functionality of this test chart by introducing the concept of measuring motion blur. This is done by having the ability to hang the chart and calculating the resultant blurriness due to the chart oscillating when moved to a high point of the hanging line.
The same concept was advised to the IEC standards, while participating in the work of this international standard on behalf of Australia, and accepted. It can be found in the Appendix of the 62676-5 standard.
A further interesting application of v.4.0 is the newly designed ViDiLabs calc App.
Here, images of the test chart are used to simulate the image quality at various compressions when deciding how much compression should be used to achieve certain length of recording and still have the expected image quality.
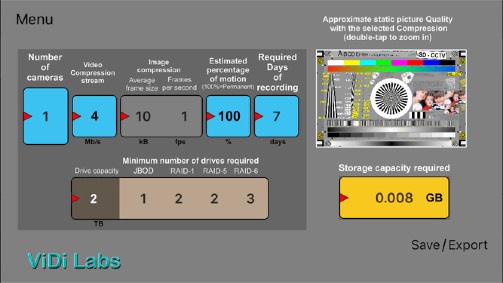
“The chart v.4.x is used to simulate various compression quality in the ViDiLabs calc app”
This is another first in the industry.
Each ViDi Labs SD/HD test chart (v. 4.0) comes with four Velcro spots on the back, one in each corner for ease of mounting to a wall. Along with a complete instruction manual, an electronic version can be downloaded from our web site.
This chart, like all previous versions, can be ordered from www.vidilabs.com.
In the next article I will explain the latest test chart design, v.5.0.